By: Cassandra McBride | Ammo.com
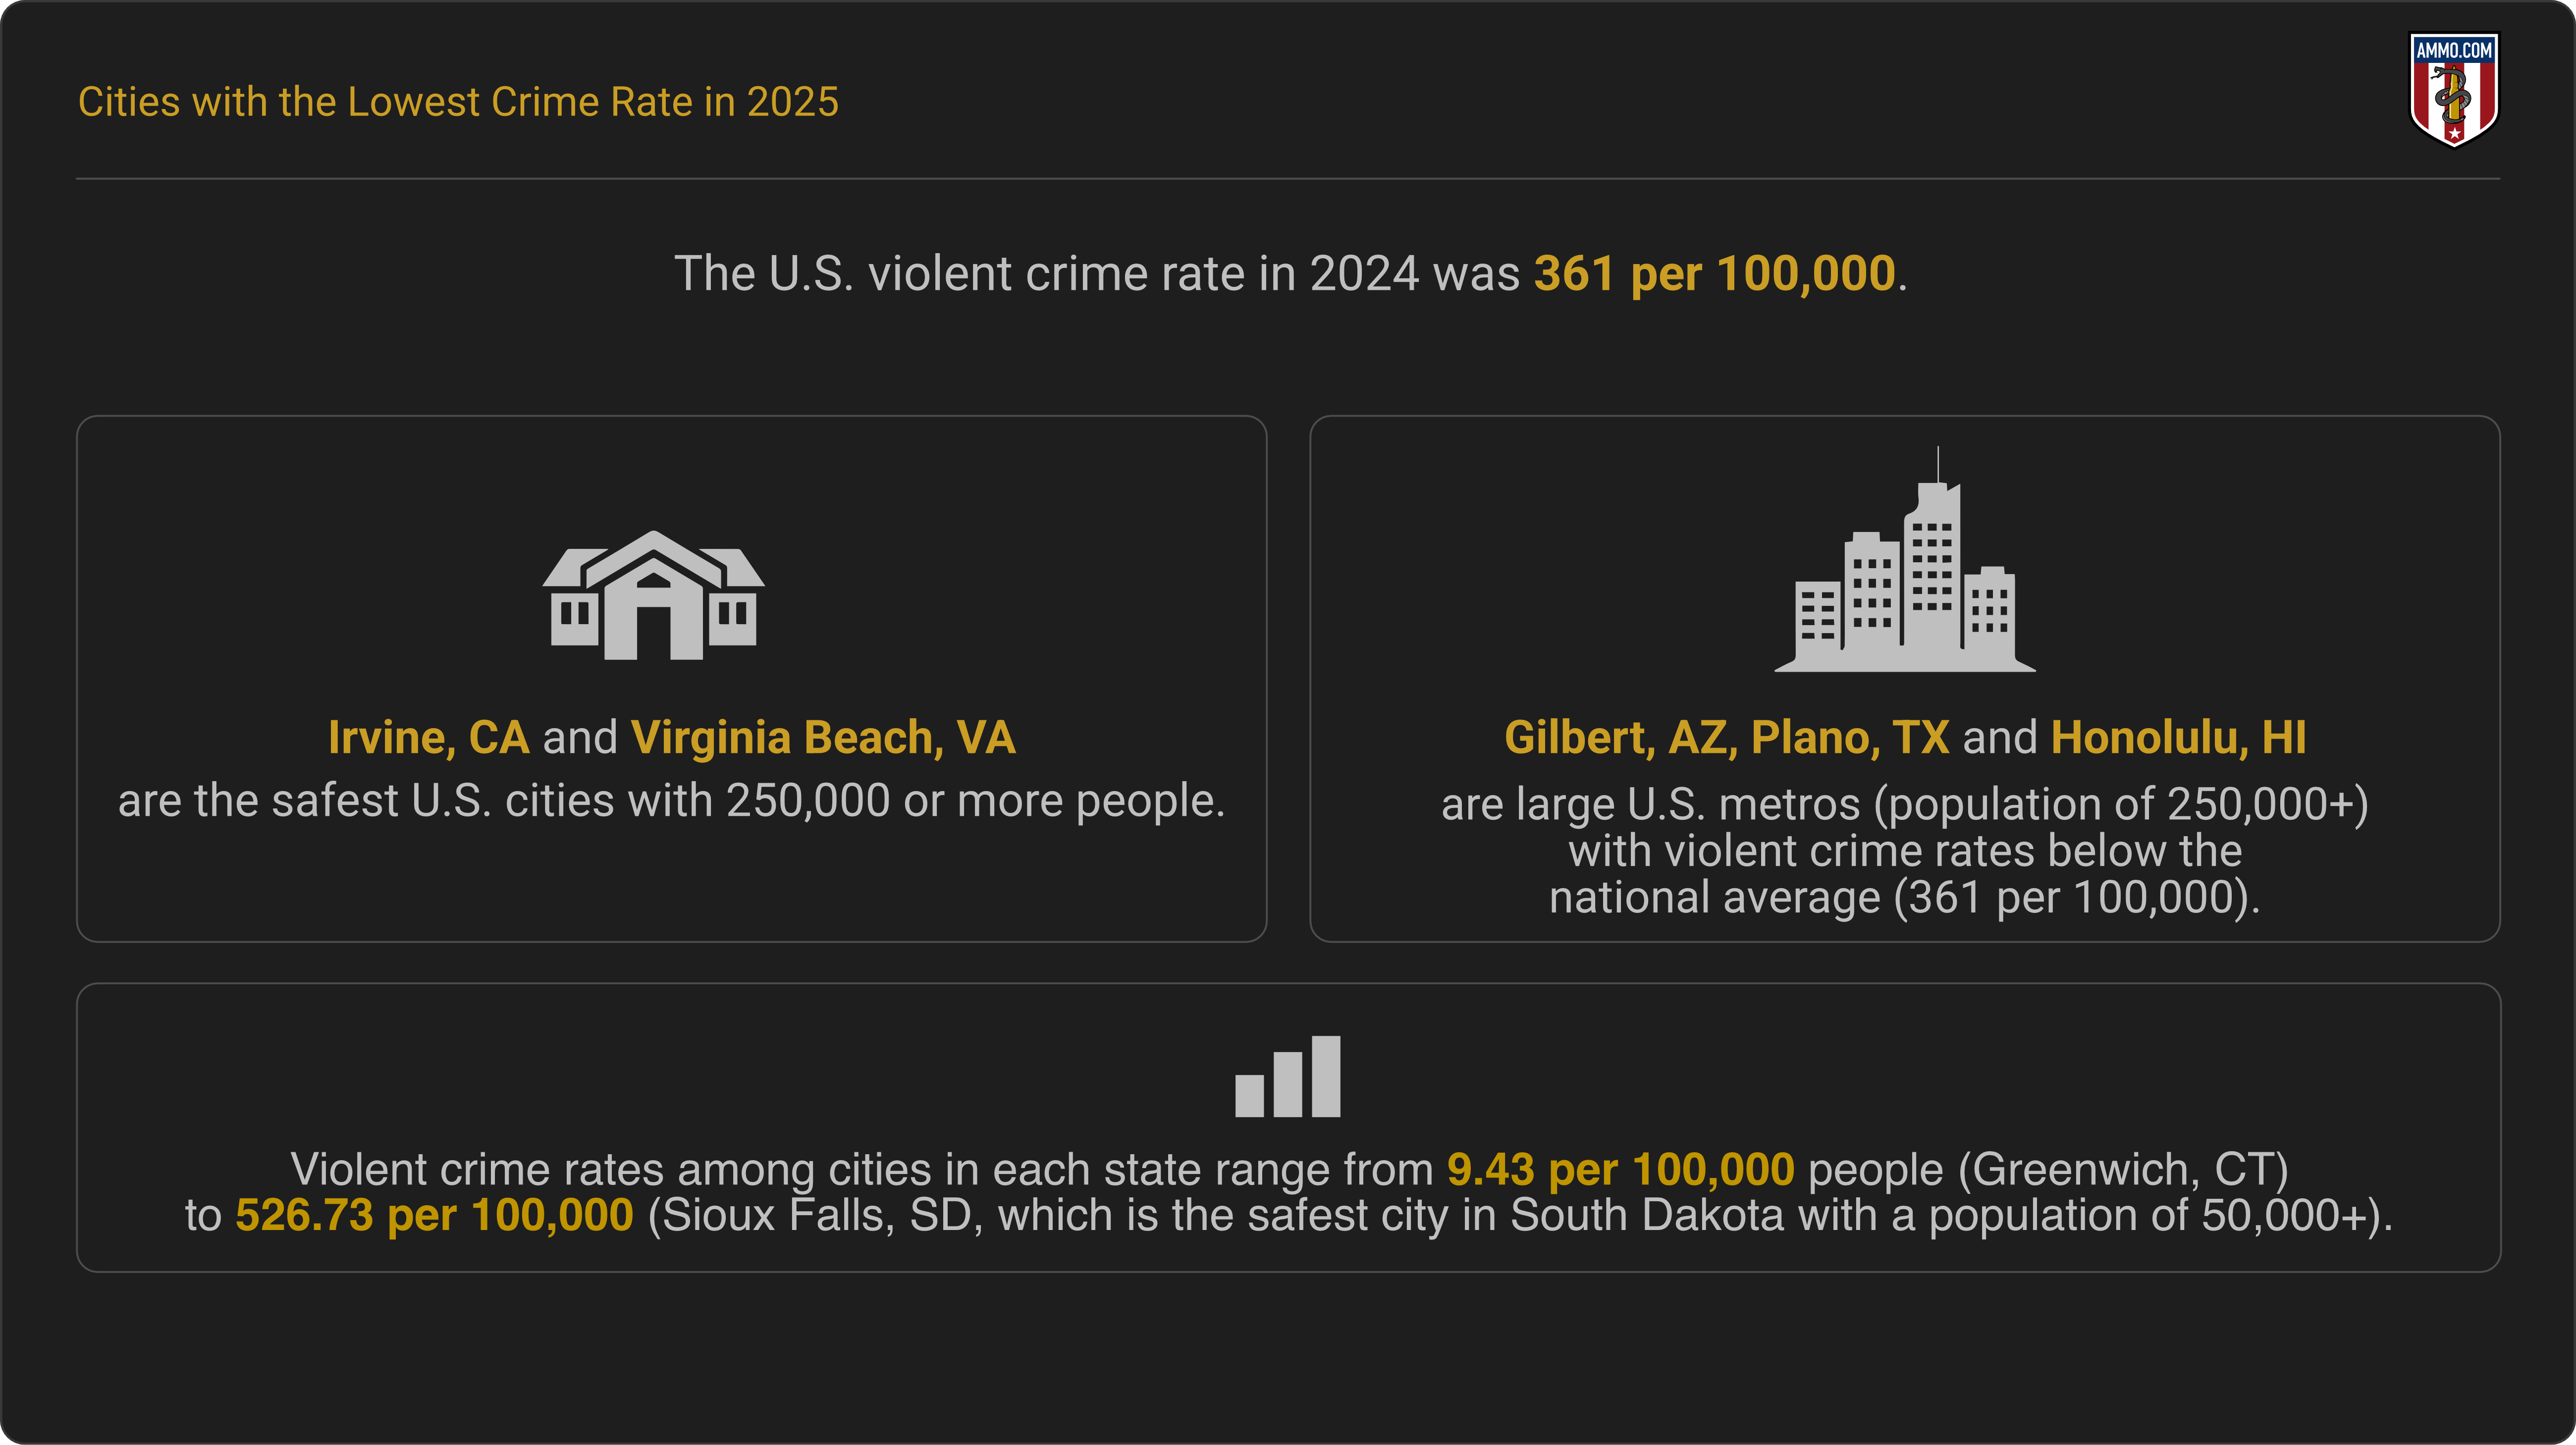
Report Highlights: Violent crime, as defined by the FBI, includes homicide, rape, robbery, and aggravated assault. The U.S. violent crime rate in 2024 was 361 per 100,000 people.
- Irvine, CA, and Virginia Beach, VA, are the safest U.S. cities with 250,000 or more people in the U.S.
- Gilbert, AZ, Plano, TX, and Honolulu, HI are large U.S. metros (250,000+ residents) with violent crime rates below the national average (361 per 100,000 people).
- Violent crime rates among cities in each state range from 9.43 per 100,000 people (Greenwich, CT) to 526.73 per 100,000 (Sioux Falls, SD, which is the safest city in South Dakota with a population of 50,000+).
Related Studies: Urban Violent Crime and Legal Gun Ownership, States With the Highest Murder Rates, Defensive Gun Use Statistics: Self-Defense Cases
Ammo.com uses reputable sources. To view the sources used in this article, click HERE.
Methodology
Data presented in this report is sourced from a variety of databases and reputable publications.
Violent crime rates in the United States are drawn primarily from the FBI’s Crime Data Explorer, which aggregates figures reported by law enforcement agencies. We cross-referenced this data with other sources (municipal reports) to improve accuracy. Only cities with at least 250,000 people were included, as smaller towns and cities often report lower violent crime rates, making meaningful comparisons with larger urban centers difficult.
This report ranks each state’s safest city using the 2024 FBI Crime Data Explorer, which follows a national definition of violent crime (i.e., homicide, rape, robbery, and aggravated assault). Each city has 12 months of reporting in 2024 to ensure accuracy. Per capita rates were calculated to overcome population inconsistencies.
To balance stability and coverage, the population threshold was set at >50,000 because cities with lower population sizes often have skewed per capita rates. Exceptions were made for states with fewer than three >50,000+ cities reporting violent crime rates in 2024.
This report is intended as an informational comparison – not an absolute ranking. Data limitations and variations in reporting mean that the figures should be understood as a benchmark for context rather than a definitive measure of safety.
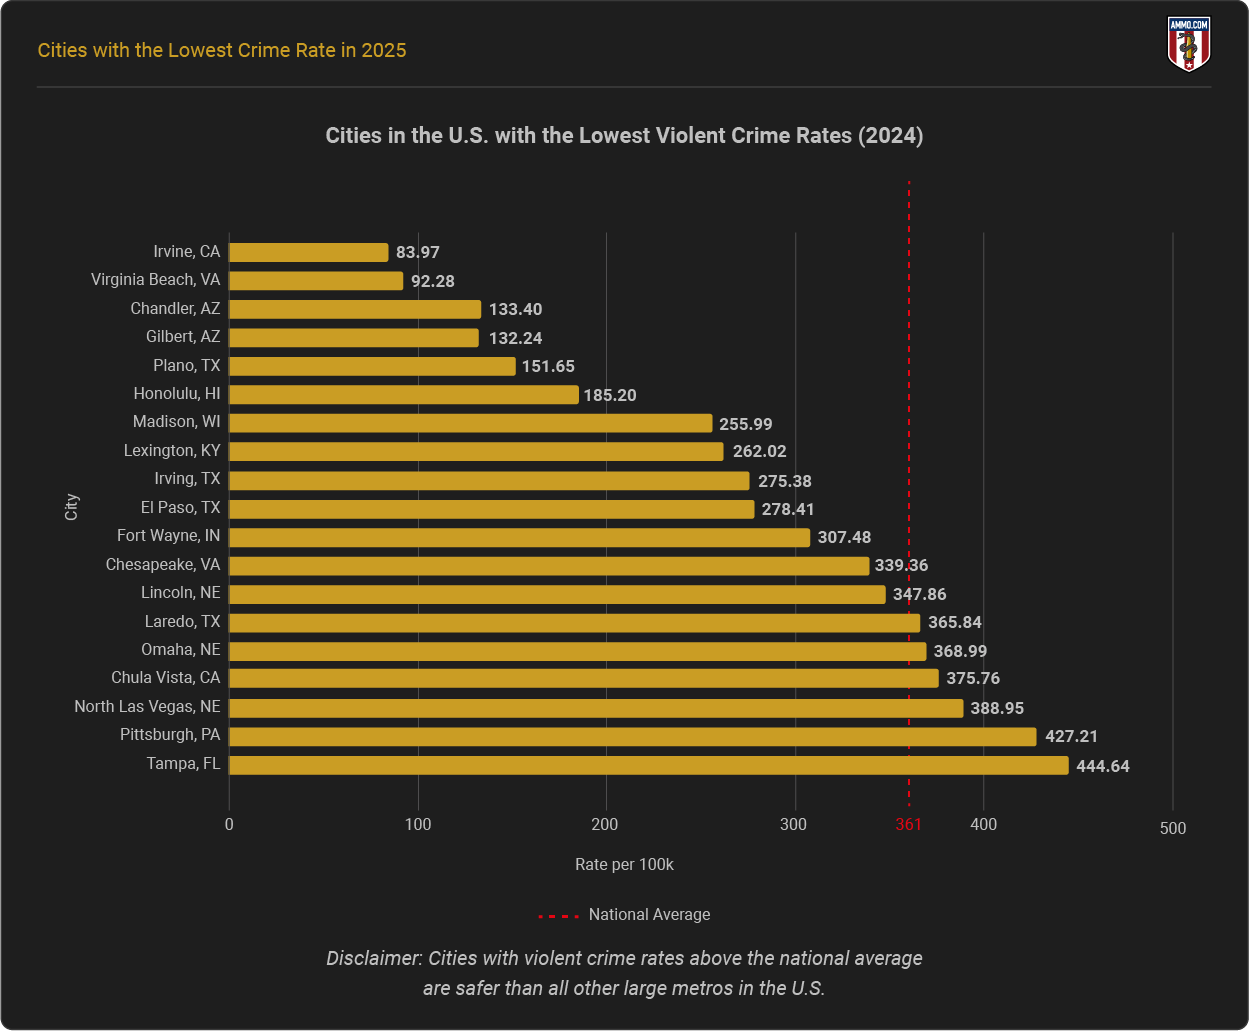
Cities With the Lowest Crime Rates in The U.S.
There are many safe cities in the U.S. Large cities like Irvine, CA, and Virginia Beach, VA rank among the lowest (83.97 and 92.28 per 100,000, respectively). Other sizable cities, such as Gilbert, AZ, Plano, TX, and Honolulu, HI, also report crime rates well below the national average of 361 per 100,000.
Disclaimer: Large cities in this section are defined as those with 250,000 or more residents. Some cities fitting this population size may not have reported crime data to the FBI. Their information is therefore not included in our list.
Safest Cities in the U.S. by State
The safest cities with a population of 50,000 or more in each state are listed below. Exceptions were necessary but are noted accordingly.
Disclaimer: The 12-month reporting requirement excluded partially counted or artificially low rates from this list to ensure that only truly safe cities are included..
Jump Links: AL | AK | AZ | AR | CA | CO | CT | DE | FL | GA | HI | ID | IL | IN | IA | KS | KY | LA | ME | MD | MA | MI | MN | MS | MO | MT | NE | NV | NH | NJ | NM | NY | NC | ND | OH | OK | OR | PA | RI | SC | SD | TN | TX | UT | VT | VA | WA | WV | WI | WY
Alabama
| City |
Population |
Total Violent Crimes |
Per 100,000 |
| Hoover |
92,352 |
72 |
77.96 |
Alaska
Exception: Alaska has fewer than three cities reporting violent rates for 2024. Therefore, the population threshold has been lowered.
| City |
Population |
Total Violent Crimes |
Per 100,000 |
| Sitka |
8,306 |
15 |
180.59 |
Arizona
| City |
Population |
Total Violent Crimes |
Per 100,000 |
| Surprise |
163,202 |
178 |
109.07 |
Arkansas
| City |
Population |
Total Violent Crimes |
Per 100,000 |
| Bentonville |
61,109 |
156 |
255.28 |
California
| City |
Population |
Total Violent Crimes |
Per 100,000 |
| Diamond Bar |
51,126 |
40 |
78.24 |
Colorado
| City |
Population |
Total Violent Crimes |
Per 100,000 |
| Castle Rock |
84,098 |
30 |
35.67 |
Connecticut
| City |
Population |
Total Violent Crimes |
Per 100,000 |
| Greenwich |
63,651 |
6 |
9.43 |
Delaware
Exception: Delaware has fewer than three cities reporting violent rates for 2024. Therefore, the population threshold has been lowered.
| City |
Population |
Total Violent Crimes |
Per 100,000 |
| Middletown |
25,594 |
32 |
125.03 |
Florida
| City |
Population |
Total Violent Crimes |
Per 100,000 |
| North Port |
93,930 |
88 |
93.69 |
Georgia
| City |
Population |
Total Violent Crimes |
Per 100,000 |
| Johns Creek |
81,056 |
29 |
35.78 |
Hawaii
Exception: Hawaii has only one municipality with a population over 50,000. Some areas may have lower violent crime rates.
| City |
Population |
Total Violent Crimes |
Per 100,000 |
| Honolulu |
992,973 |
1,839 |
185.20 |
Idaho
| City |
Population |
Total Violent Crimes |
Per 100,000 |
| Meridian |
140,353 |
206 |
146.77 |
Illinois
| City |
Population |
Total Violent Crimes |
Per 100,000 |
| Orland Park |
56,593 |
16 |
28.27 |
Indiana
| City |
Population |
Total Violent Crimes |
Per 100,000 |
| Columbus |
51,867 |
7 |
13.50 |
Iowa
| City |
Population |
Total Violent Crimes |
Per 100,000 |
| Ames |
65,426 |
97 |
148.26 |
Kansas
| City |
Population |
Total Violent Crimes |
Per 100,000 |
| Lenexa |
58,871 |
108 |
183.45 |
Kentucky
| City |
Population |
Total Violent Crimes |
Per 100,000 |
| Bowling Green |
77,503 |
174 |
224.51 |
Louisiana
| City |
Population |
Total Violent Crimes |
Per 100,000 |
| Kenner |
62,377 |
215 |
344.68 |
Maine
Exception: Maine has fewer than three cities reporting violent rates for 2024. Therefore, the population threshold has been lowered.
| City |
Population |
Total Violent Crimes |
Per 100,000 |
| Scarborough |
24,147 |
15 |
62.12 |
Maryland
| City |
Population |
Total Violent Crimes |
Per 100,000 |
| Rockville |
67,285 |
101 |
150.11 |
Massachusetts
| City |
Population |
Total Violent Crimes |
Per 100,000 |
| Newton |
89,935 |
44 |
48.92 |
Michigan
| City |
Population |
Total Violent Crimes |
Per 100,000 |
| West Bloomfield Township |
64,892 |
53 |
81.67 |
Minnesota
| City |
Population |
Total Violent Crimes |
Per 100,000 |
| Plymouth |
76,577 |
39 |
50.93 |
Mississippi
Exception: Mississippi has fewer than three cities reporting violent rates for 2024. Therefore, the population threshold has been lowered.
| City |
Population |
Total Violent Crimes |
Per 100,000 |
| Olive Branch |
47,178 |
94 |
199.25 |
Missouri
| City |
Population |
Total Violent Crimes |
Per 100,000 |
| O’Fallon |
94,911 |
56 |
59 |
Montana
| City |
Population |
Total Violent Crimes |
Per 100,000 |
| Bozeman |
58,509 |
254 |
434.12 |
Nebraska
| City |
Population |
Total Violent Crimes |
Per 100,000 |
| Bellevue |
63,510 |
63 |
99.20 |
Nevada
| City |
Population |
Total Violent Crimes |
Per 100,000 |
| Henderson |
343,619 |
936 |
272.39 |
New Hampshire
| City |
Population |
Total Violent Crimes |
Per 100,000 |
| Nashua |
90,938 |
146 |
160.55 |
New Jersey
| City |
Population |
Total Violent Crimes |
Per 100,000 |
| Jackson Township |
62,326 |
25 |
40.11 |
New Mexico
| City |
Population |
Total Violent Crimes |
Per 100,000 |
| Rio Rancho |
112,817 |
359 |
318.21 |
New York
| City |
Population |
Total Violent Crimes |
Per 100,000 |
| Southampton |
59,965 |
35 |
58.37 |
North Carolina
| City |
Population |
Total Violent Crimes |
Per 100,000 |
| Cary |
181,793 |
129 |
70.96 |
North Dakota
| City |
Population |
Total Violent Crimes |
Per 100,000 |
| Bismarck |
75,546 |
210 |
277.98 |
Ohio
| City |
Population |
Total Violent Crimes |
Per 100,000 |
| Kettering |
56,562 |
24 |
42.43 |
Oklahoma
| City |
Population |
Total Violent Crimes |
Per 100,000 |
| Edmond |
99,249 |
164 |
165.24 |
Oregon
| City |
Population |
Total Violent Crimes |
Per 100,000 |
| Bend |
106,241 |
179 |
168.48 |
Pennsylvania
| City |
Population |
Total Violent Crimes |
Per 100,000 |
| Haverford Township |
50,544 |
11 |
21.76 |
Rhode Island
| City |
Population |
Total Violent Crimes |
Per 100,000 |
| Warwick |
84,297 |
67 |
79.48 |
South Carolina
| City |
Population |
Total Violent Crimes |
Per 100,000 |
| Mount Pleasant |
96,608 |
124 |
128.35 |
South Dakota
| City |
Population |
Total Violent Crimes |
Per 100,000 |
| Sioux Falls |
210,926 |
1,111 |
526.73 |
Tennessee
| City |
Population |
Total Violent Crimes |
Per 100,000 |
| Hendersonville |
64,126 |
79 |
123.19 |
Texas
| City |
Population |
Total Violent Crimes |
Per 100,000 |
| Flower Mound |
80,455 |
46 |
57.17 |
Utah
| City |
Population |
Total Violent Crimes |
Per 100,000 |
| Lehi |
95,189 |
84 |
88.25 |
Vermont
Exception: Vermont has fewer than three cities reporting violent rates for 2024. Therefore, the population threshold has been lowered.
| City |
Population |
Total Violent Crimes |
Per 100,000 |
| Essex |
22,347 |
25 |
111.87 |
Virginia
| City |
Population |
Total Violent Crimes |
Per 100,000 |
| Virginia Beach |
455,155 |
420 |
92.28 |
Washington
| City |
Population |
Total Violent Crimes |
Per 100,000 |
| Sammamish |
64,358 |
18 |
27.97 |
West Virginia
Exception: West Virginia has fewer than three cities reporting violent rates for 2024. Therefore, the population threshold has been lowered.
| City |
Population |
Total Violent Crimes |
Per 100,000 |
| Weirton |
18,151 |
25 |
137.73 |
Wisconsin
| City |
Population |
Total Violent Crimes |
Per 100,000 |
| Waukesha |
70,202 |
80 |
113.96 |
Wyoming
| City |
Population |
Total Violent Crimes |
Per 100,000 |
| Casper |
58,526 |
169 |
288.76 |
Wrap Up
Irvine, CA, and Virginia Beach, VA are the safest large cities in the U.S. with populations over 250,000 people. Violent crime rates vary across the nation, but using the FBI Crime Data Explorer provides uniformity and fair comparisons among cities in each state. Although many cities did not qualify for this report due to data limitations, the cities listed above are among the safest in the U.S., nevertheless.
Sources
- FBI Crime Data Explorer
- Safest Places to Live in the U.S.: 2025-2026