

By: Cassandra McBride | Ammo.com
Report Highlights: Decades of national and state-level data on violent crime, homicide, and mass shooting show no consistent evidence that stricter gun laws reduce overall crime rates.
- U.S. violent crime increased 261% between 1966 and 1993, rising from 189 incidents per 100,000 residents to 682 per 100,000. It began declining in 1999.
- In 2024, states with strict gun laws had an average homicide rate of 5.93 per 100,000 residents, compared to 5.91 in mixed-law states and 6.95 in relaxed-law states.
- In 2024, states with strict gun laws had an average suicide rate of 13.03 per 100,000 residents, compared with 18.10 in mixed-law states and 19.00 in relaxed-law states.
Related Studies: Easiest States to Buy a Gun, States With the Highest Murder Rate, Gun Ownership by State
Ammo.com provides reliable data from reputable sources. You can view the sources used in this article here.
Methodology
The states in this article are ranked according to the level of their gun laws: relaxed, strict, and mixed.
- Relaxed – State does not require background checks or waiting periods before private sales, or restricts firearms or ammunition.
- Strict – State requires background checks on private sales, bans certain types of firearms or ammunition, and has further legislated to restrict firearm ownership or possession.
- Mixed – State allows concealed carry, but also requires background checks on private sales and/or waiting periods before the purchase of firearms.
The CDC provides death data from all U.S. counties. Homicide data pulled from the WONDER Database includes negligent and justifiable homicides. Violent crime data from the FBI Crime Data Explorer relies on agency reporting and may underrepresent actual crime rates.
State gun law rankings align with the policies at the time the data were reported. For example, states with less gun control are ranked according to the year of the homicide data.
Gun Laws and Crime in Numbers
There were 19,918 homicides in 2024. Of those, 15,403 (77%) were committed with firearms. 16
Federal Gun Laws vs. Crime Rates
Despite the enactment of many new federal gun control laws, U.S. violent crime rates increased 261% from 1966 to 1993. 13, 14
- Violent crime rates before the Gun Control Act of 1968 averaged 189 incidents per 100,000 people.
- From 1969 to 1985, violent crime rates increased to an average of 474 per 100,000.
- From 1986 to 1993, violent crime rates increased to an average of 682 per 100,000.
- Violent crime rates remained high between 1993 and 1998 when the Brady Handgun Violence Prevention Act’s five-day waiting period was in effect.
- Violent crime rates declined after 1999, with an average of 420 incidents per 100,000 in 2025.
National violent crime rates do not trend down in response to sweeping federal gun control legislation. This does not suggest that relaxed gun laws reduce crime, but does indicate that federal gun control has not produced measurable reductions in violent crime.
State Gun Laws and Crime Rates
On average, states with relaxed gun control laws have higher gun death and homicide rates than states that restrict certain firearm purchases and concealed or open carry. Suicide is the driving factor in higher gun death rates across all state rankings. 4, 8, 12, 13, 14
Outliers in homicide rates include relaxed gun control states such as New Hampshire, Idaho, Utah, Iowa, and South Dakota, with much lower homicide rates in 2024 than most other states. Conversely, Illinois and Maryland are states with strict gun control laws and much higher homicide rates than most states.
- Strict gun control states had an average gun death rate of 11.00 per 100,000 people, and a homicide rate of 5.96 per 100,000 in 2024.
- Mixed gun control states had an average gun death rate of 15.67 per 100,000 people, and a homicide rate of 5.91 per 100,000 in 2024.
- Relaxed gun control states had an average gun death rate of 18.00 per 100,000 people, and a homicide rate of 6.96 per 100,000 in 2024.
Homicide rates include all methods and justifiable homicides. Death rates include all intents (homicide, suicide, legal intervention, and unintentional).
Each State Gun Violence Per Capita by Intent
Gun Laws and Gun Violence
Do Strict Gun Laws Reduce Violent Crime?
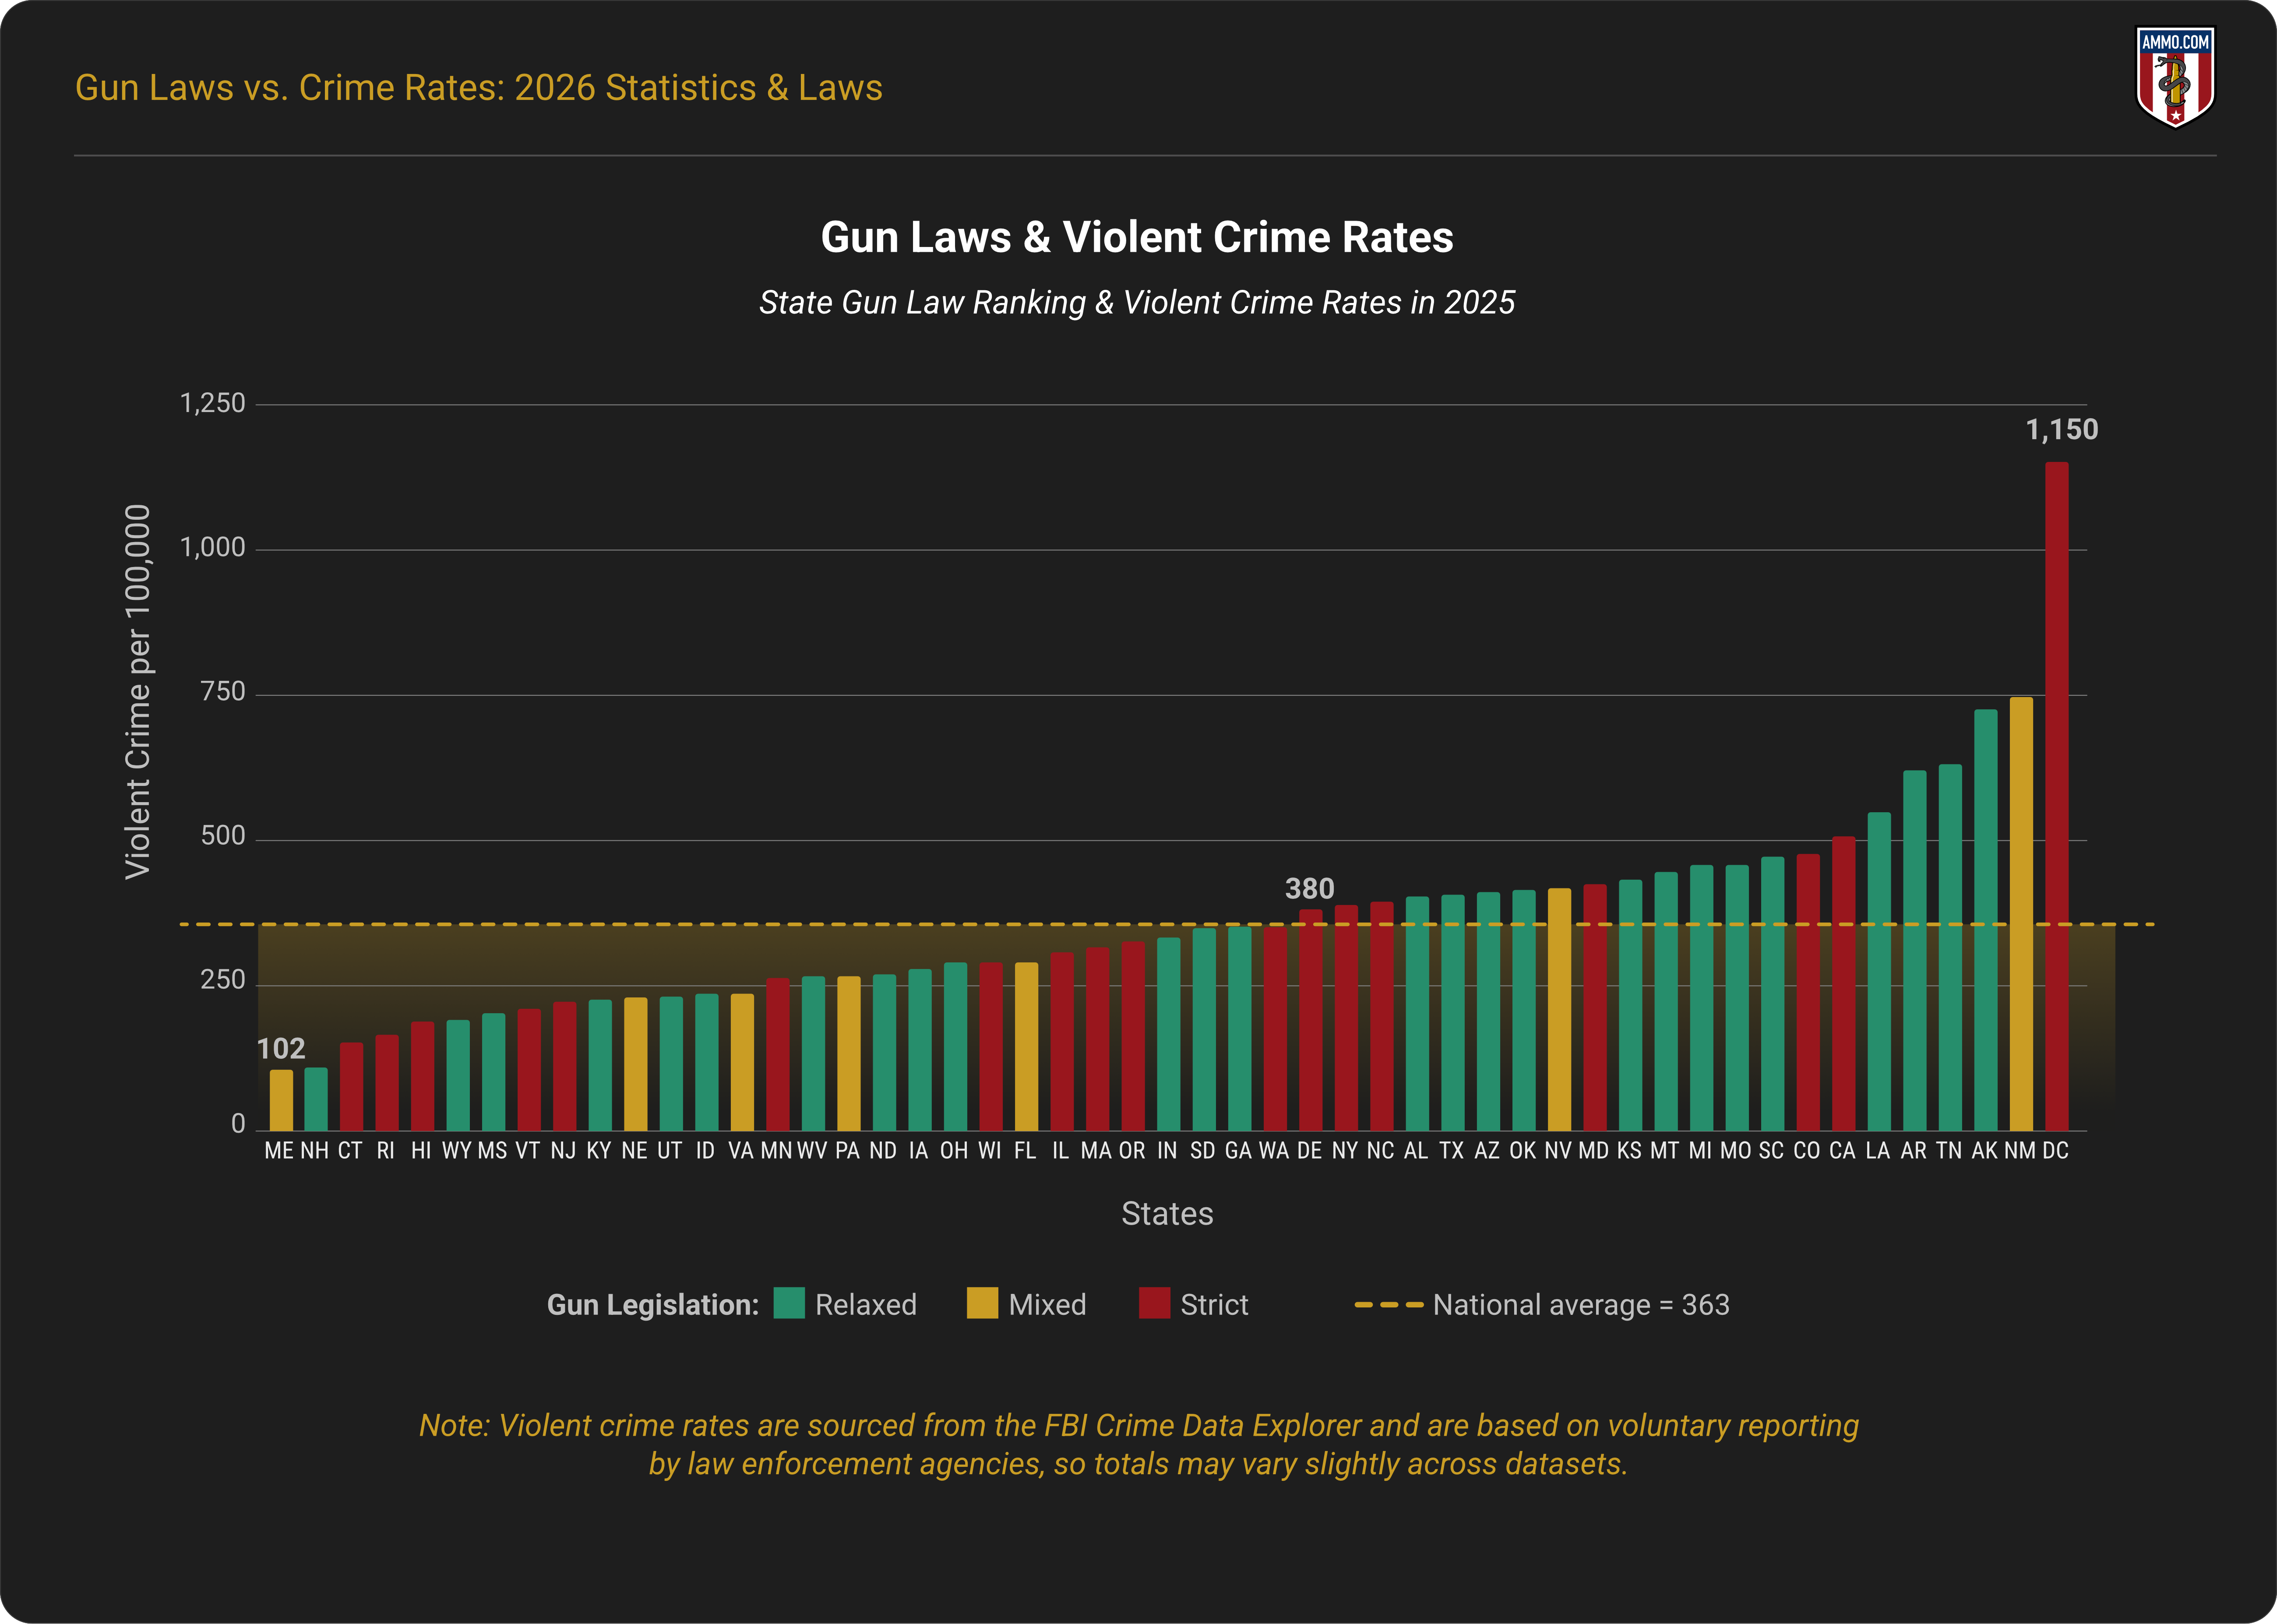
There is no consistent relationship between gun laws and violent crime. Eighteen states and Washington, D.C. have strict gun laws. Washington D.C. and six strict states had violent crime rates above the national average, while 11 had violent crime rates below it in 2025. 12, 13, 14
Twenty-six states have relaxed gun laws. Thirteen of those have crime rates below the national average. The other half have crime rates above it.
Five of seven states with a mix of relaxed and strict gun laws also have crime rates below the national average. In the category, only Nevada and New Mexico have crime rates above the national average.
Do Strict Gun Control Laws Reduce the Number of Homicides?
Homicide rates vary across all state gun law rankings. In 2024, states classified as having strict gun laws had an average homicide rate of 5.93 deaths per 100,000 residents, including 4.34 firearm homicides per 100,000.
States with a mixed ranking had a slightly higher average homicide rate of 5.91 per 100,000, including 4.44 firearm homicides. Relaxed states had the highest average homicide rate at 6.95 per 100,000 residents, including 5.35 firearm homicides per 100,000.
A small number of states report homicide rates far above the national average, which can influence category averages. For example, Washington, D.C., Mississippi, and Louisiana report substantially higher homicide rates than other jurisdictions, whereas several states, including Maine, Massachusetts, and Idaho, report comparatively low homicide rates. These outliers illustrate the wide variation in homicide rates across states and indicate other factors such as regional, demographic, and economic causes. 16
Do Strict Gun Control Laws Reduce Mass Shootings?
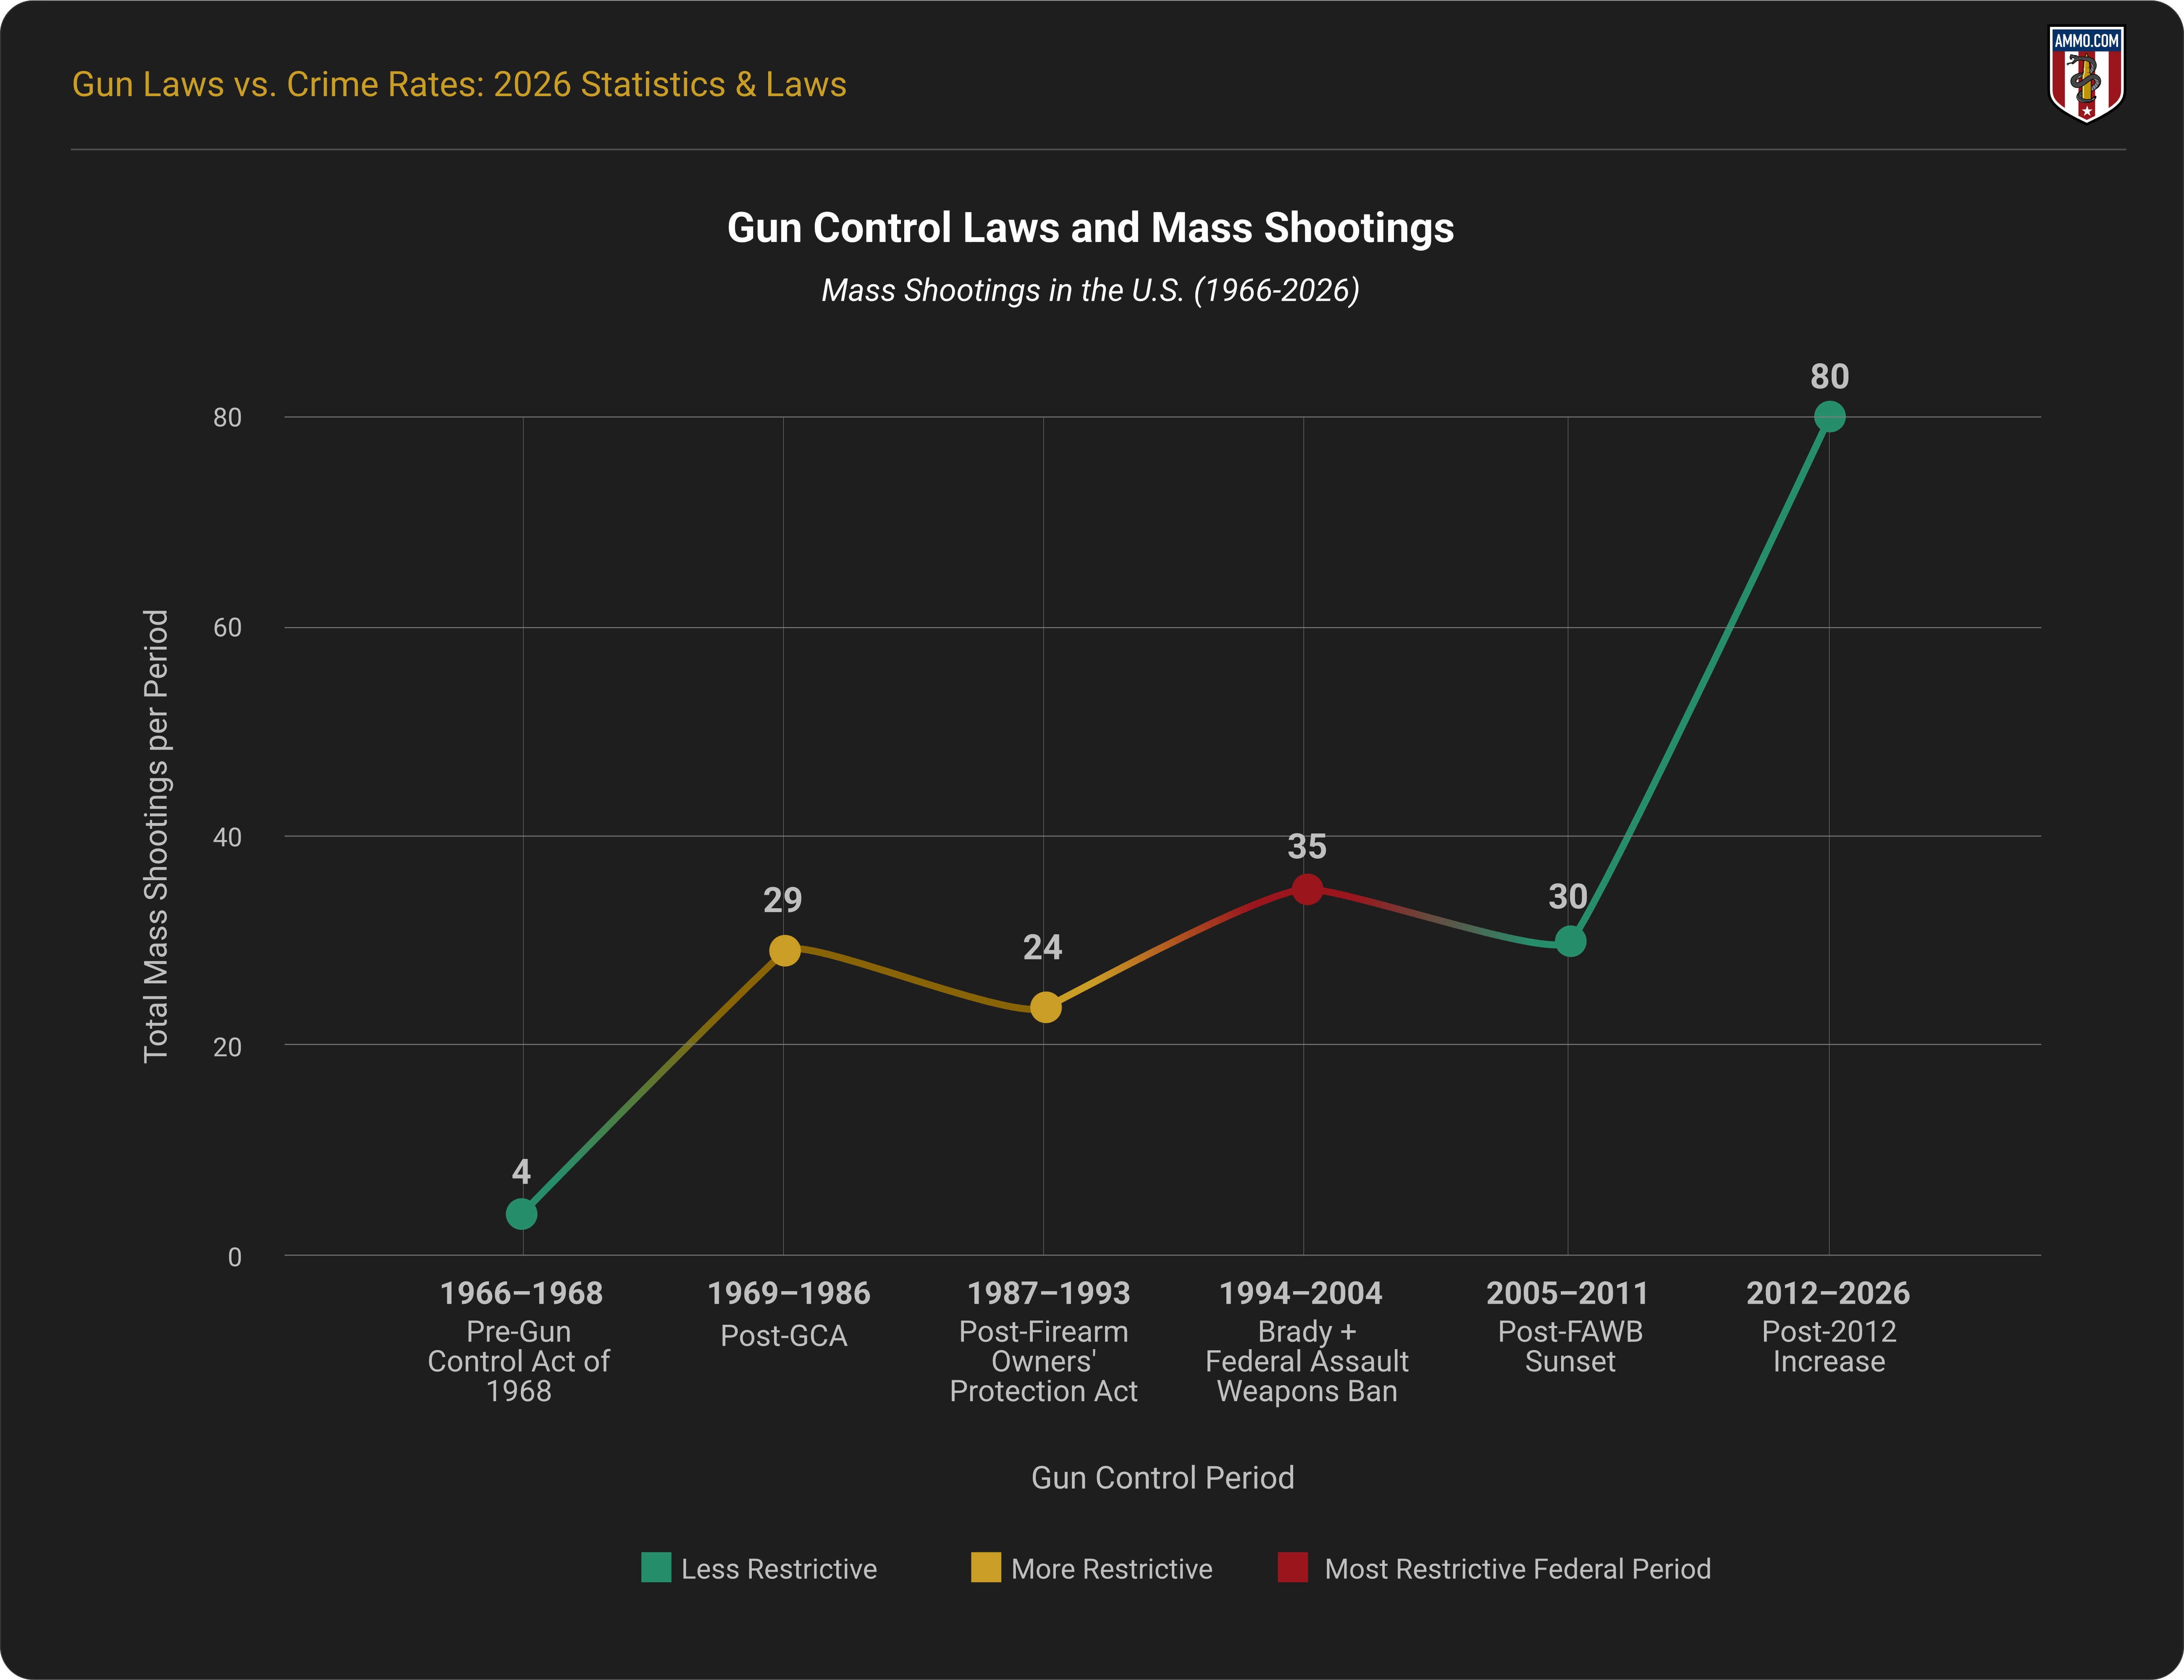
Between 1966 and 1986, mass shootings in this dataset were relatively rare, averaging about 1.6 incidents per year. During this period, Congress passed the Gun Control Act of 1968 prohibiting firearm possession by certain categories of individuals (such as felons). It later passed the Firearm Owners’ Protection Act, which, among other provisions, prohibits civilians from possessing machine guns manufactured after May 19th, 1986.
In the early 90s, the rate of mass shootings increased to roughly three to four per year. This increase transpired during the period of the Federal Assault Weapons Ban (1994-2004). The rate increased again to roughly five to six incidents per year by around 2012; a period in which the existing federal framework for gun control, including the Gun Control Act, remained largely unchanged. 16
Do Gun Control Laws Reduce Suicides?
Suicide rates vary across all state rankings, with outliers in all three categories.
In 2024, states classified as having strict gun laws had an average total suicide rate of 13.03 deaths per 100,000 residents, including 6.10 firearm suicides per 100,000.
Mixed states had an average suicide rate of 18.10 per 100,000, including 10.62 firearm suicides. Relaxed states had the highest overall suicide rate at 19.00 per 100,000 residents, including 12.12 firearm suicides per 100,000.
Regional suicide patterns also cross policy categories. For example, several Western states with high suicide rates have relaxed firearm laws, while others with stricter laws, such as Colorado and Oregon, also report relatively high suicide rates. Conversely, several Northeastern states with strict laws report suicide rates among the lowest in the country. 17
Do Countries With Strict Gun Laws Have Less Gun Violence?
International comparisons suggest that countries with strict gun laws do not necessarily have less gun violence. Some countries that have strict gun laws also have the highest rates of gun violence in the world, while others have the lowest. 11
- Jamaica, Ecuador, Honduras, Belize, and Mexico have strict gun laws and regulations. They also have the highest gun violence rates in the world.
- Austria, Bosnia and Herzegovina, Switzerland, and the U.S. have relatively relaxed gun laws, yet they averaged fewer than five gun-related homicides per 100,000 residents in 2023.
- Australia, Japan, and the U.K. have strict gun laws and low firearm-related homicide rates.
Wrap-Up
Decades of U.S. and international data do not show consistent evidence supporting the conclusion that gun control lowers crime rates. Homicides, suicides, mass shootings, and violent crime statistics vary independently of gun laws.
Sources
- The 1994 FAWB
- 1986 FOPA
- Brady Handgun Violence Prevention Act (1993/1994)
- Violent Crime Data
- BJS Report Crime Guns
- Homicide Rates in El Salvador
- Mass Shootings in the U.S.
- Violent Crime Rates in the U.S.
- Violent Crimes in the U.K.
- Australia Crime Stats
- Murder Rate by Country
- Crime Rate by State: 2025
- FBI Crime Data Explorer
- U.S. Crime Data 1960-2019
- Gun Deaths by Country
- Mass Shooters Database
- CDC WONDER Provisional Data